Evaluating IT Help Desk Performance: Key Metrics to Track
IT help desk performance evaluation directly impacts your MSP’s profitability and client retention. Poor metrics cost businesses an average of $5,600 per hour in downtime.
Which Metrics Actually Matter for Help Desk Success
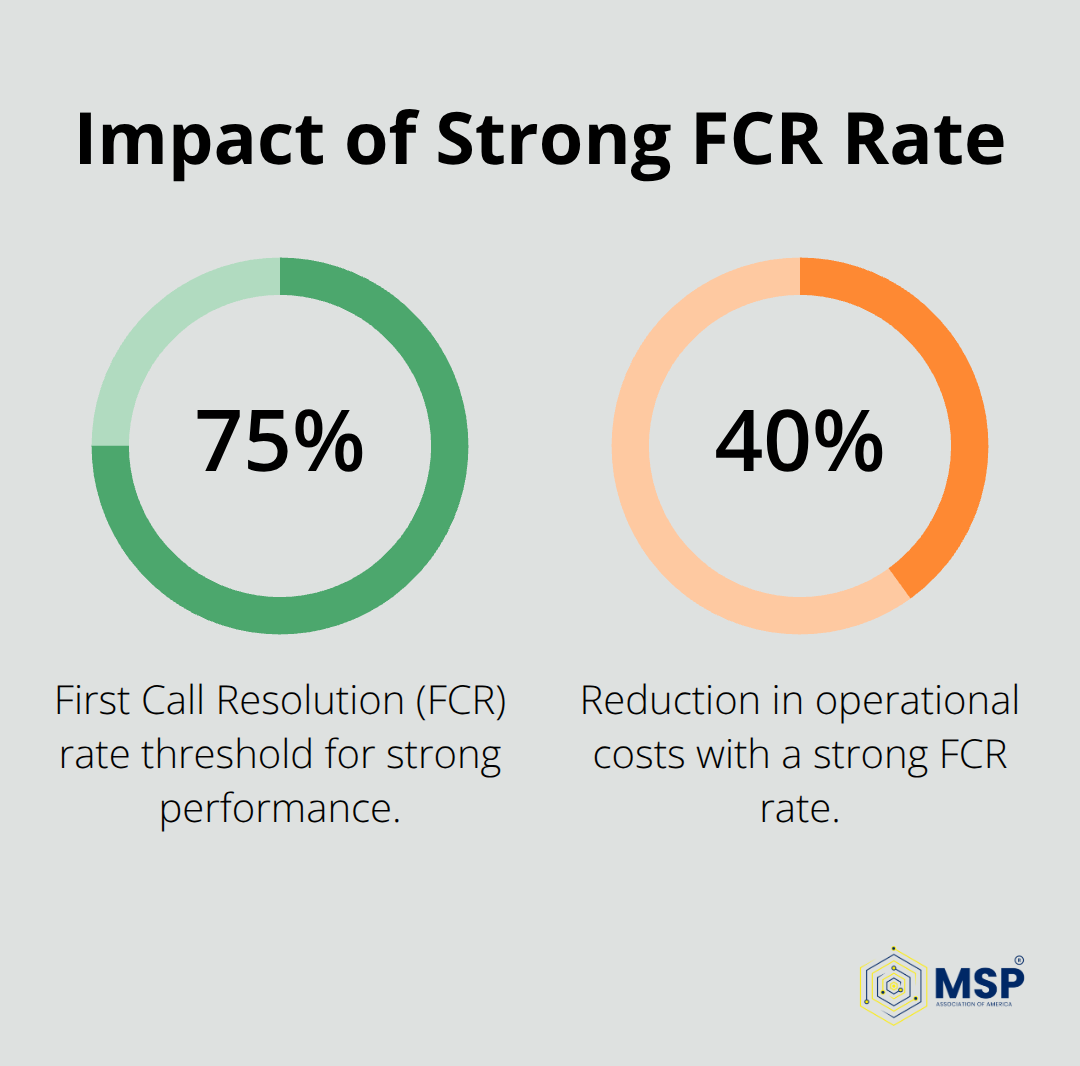
First call resolution rate stands as the single most important metric for MSP help desks. A strong FCR rate of 75% or higher reduces operational costs by 40% while it boosts client satisfaction significantly. Most MSPs track this incorrectly when they count callbacks within 24 hours as resolved tickets. The right approach measures only issues that technicians solve completely during the initial contact without any follow-up required. ServiceNow research shows that every 1% improvement in FCR reduces total support costs by $276,000 annually for mid-sized operations.
Response Time Standards That Drive Results
Average response time below 15 minutes separates top-performing MSPs from mediocre ones. HDI reports that 67% of clients switch providers when initial response exceeds 30 minutes. Track response time by priority level: critical issues need 5-minute response, high priority requires 15 minutes, and standard tickets should receive acknowledgment within 2 hours. Resolution time varies dramatically by issue complexity, but try for 4-hour average resolution on standard requests. Microsoft data indicates that when MSPs reduce average resolution time from 8 hours to 4 hours, client retention increases by 23%.
Client Satisfaction Measurement Systems
CSAT scores between 65% to 80% represent dominant performance values across industries, with scores below this range signaling serious performance problems that require immediate intervention. Send automated satisfaction surveys within 2 hours of ticket closure to achieve 35% response rates. Forrester research demonstrates that MSPs with CSAT scores above 4.5 grow revenue 12% faster than competitors. Track satisfaction by technician, ticket type, and resolution method to identify specific improvement areas. Net Promoter Scores above 50 indicate exceptional service quality, while scores below 20 suggest clients actively discourage others from using your services.
Ticket Volume and Escalation Patterns
Ticket volume analysis reveals capacity limitations and staffing needs across your help desk operations. Monitor daily ticket volumes (typically 15-25 tickets per technician) and identify peak periods that strain resources. Escalation rates above 15% indicate knowledge gaps or inadequate first-level support training. Track escalation patterns by issue type and technician to pinpoint specific training opportunities. Advanced analytics reveal seasonal trends and help predict future resource requirements for optimal performance.
How Do Advanced Analytics Transform Help Desk Performance
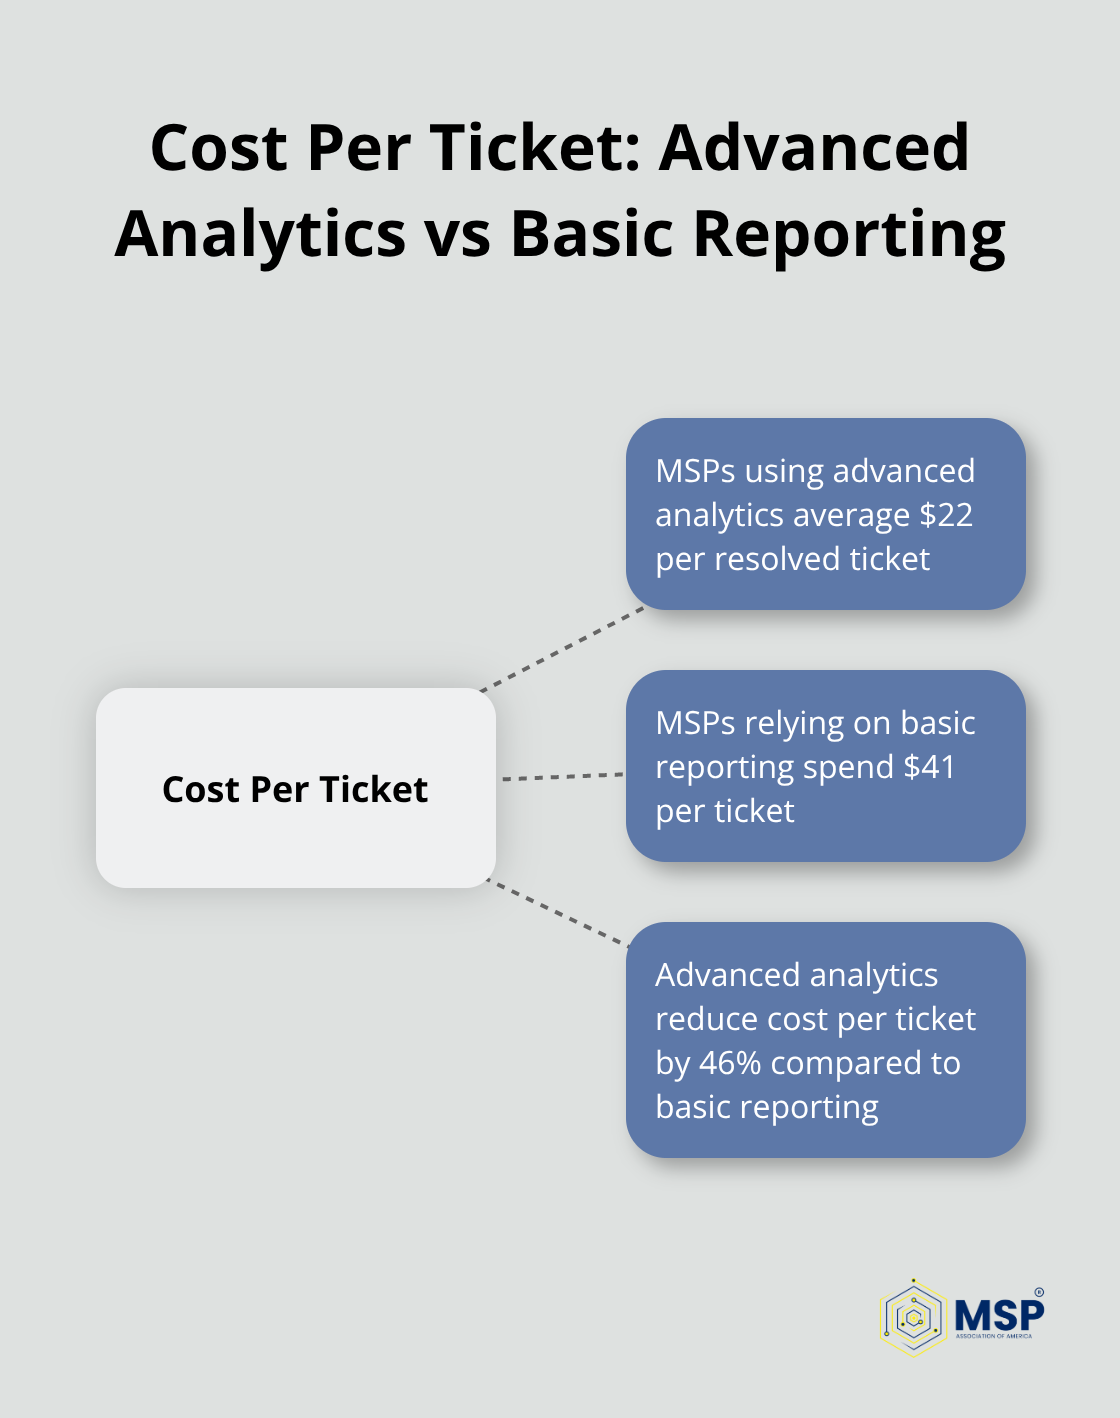
Real-time dashboards transform help desk management from reactive firefighting to proactive optimization. MSPs who use comprehensive performance dashboards can significantly improve their operational efficiency and technician productivity. Your dashboard must display first call resolution rates, average response times, and technician utilization rates in live updates. ServiceNow research indicates that MSPs who track cost per ticket through advanced analytics average $22 per resolved ticket, while those who rely on basic reporting spend $41 per ticket. Track resource utilization rates between 75-85% to optimize staffing without overwhelming technicians.
Predictive Analytics That Actually Work
Trend analysis reveals patterns that basic reporting misses completely. Microsoft System Center data demonstrates that MSPs who use predictive analytics reduce emergency escalations by 43% through early problem identification. Monitor ticket volume trends by day, week, and month to predict staffing needs three months ahead. Track seasonal patterns in specific issue types like password resets and software problems. Gartner research shows that MSPs who implement predictive maintenance based on ticket trends reduce client downtime by 37% and increase contract renewals by 19%.
SLA Compliance Monitoring Systems
SLA compliance tracking must measure actual performance against contracted commitments, not internal goals. MSPs who achieve high SLA compliance rates demonstrate superior service delivery and maintain stronger client relationships. Track compliance by priority level, client, and issue type to identify specific problem areas. Automated SLA monitoring systems send alerts when tickets approach deadline violations (which gives technicians time to escalate appropriately). ManageEngine data reveals that MSPs who use automated SLA tracking improve compliance rates from 78% to 94% within six months of implementation.
Cost Analysis and Resource Optimization
Cost per ticket analysis provides the financial foundation for help desk optimization decisions. Track direct costs including technician wages, software licenses, and infrastructure expenses against ticket volume to calculate true operational costs. Monitor resource allocation patterns to identify peak demand periods that require additional staffing or automation solutions. Advanced cost analytics help MSPs price services accurately while maintaining profitable margins across different service tiers.
The right monitoring tools and technologies make these advanced analytics possible, but selecting the wrong platform can waste resources and provide misleading data.
Which Tools Actually Deliver Measurable Results
ConnectWise Manage and Autotask PSA dominate the MSP help desk market because they track the metrics that matter most for profitability. ConnectWise users benefit from improved ticket resolution processes compared to generic help desk solutions. Autotask provides real-time SLA compliance tracking that prevents deadline violations through automated alerts. ServiceNow IT Service Management costs significantly more but delivers enterprise-grade analytics that justify the investment for MSPs who manage over 500 endpoints.
PSA Platform Selection Criteria
Choose platforms that integrate directly with your existing technology stack rather than standalone solutions. ConnectWise Manage excels at automated workflow creation and technician productivity tracking across multiple client environments. Autotask PSA offers superior financial reporting capabilities that calculate true profit margins per client contract. Both platforms provide mobile applications that allow technicians to update tickets and track time from any location.
Avoid basic systems like osTicket or Spiceworks that lack the advanced reporting capabilities needed for serious performance optimization. These limited platforms cannot track cost per ticket accurately or provide predictive analytics for capacity planning.
Business Intelligence Integration
Power BI integration with your PSA system creates dashboards that reveal performance patterns invisible in standard reports. MSPs who implement Power BI analytics can identify significant cost-saving opportunities through improved operational insights. Tableau connects with multiple data sources simultaneously to provide comprehensive performance views across different tools and systems.
These platforms calculate true cost per ticket by factoring in technician wages, overhead expenses, and tool licensing costs. Advanced visualization tools transform raw ticket data into actionable insights that drive operational improvements and client satisfaction gains.
Automated Alert Systems
Automated alert systems notify managers when first call resolution rates drop below 70% or when escalation rates exceed 15% thresholds. These real-time notifications prevent small problems from becoming major performance issues that affect client relationships. Smart alert systems filter noise and focus attention on metrics that directly impact profitability and service quality.
The key advantage lies in predictive analytics that forecast peak demand periods three weeks ahead (which allows optimal staff scheduling and resource allocation). Advanced monitoring tools track technician utilization rates and automatically redistribute workloads when capacity limits approach dangerous levels.
Final Thoughts
IT help desk performance evaluation requires consistent tracking of the right metrics rather than collecting data without purpose. First call resolution rates above 75%, response times under 15 minutes, and CSAT scores between 65-80% form the foundation of successful MSP operations. These metrics directly correlate with client retention and operational profitability.
Implementation starts with selecting the right PSA platform that integrates with your existing technology stack. ConnectWise Manage and Autotask PSA provide the advanced analytics capabilities needed for serious performance optimization. Automated alert systems prevent small issues from becoming major problems that damage client relationships.
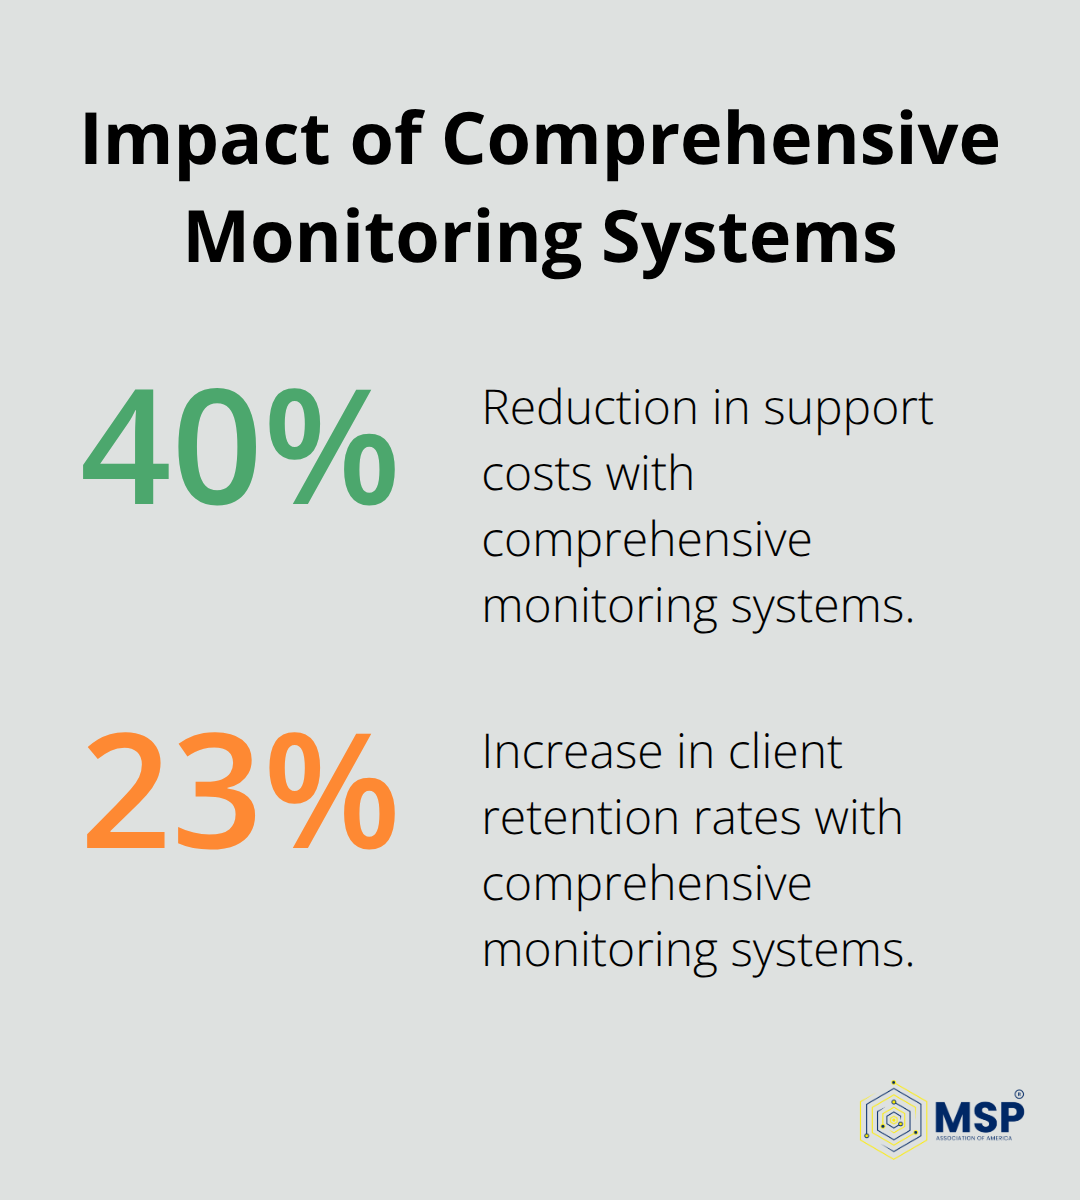
MSPs who implement comprehensive monitoring systems reduce support costs by 40% while they increase client retention rates by 23%. Predictive analytics help forecast staffing needs three months ahead and reduce emergency escalations by 43% (which positions MSPs for sustainable growth in competitive markets). We at MSP Association of America® connect businesses with qualified managed service providers who understand the importance of performance measurement.